

An automatic monthly IT service report for management
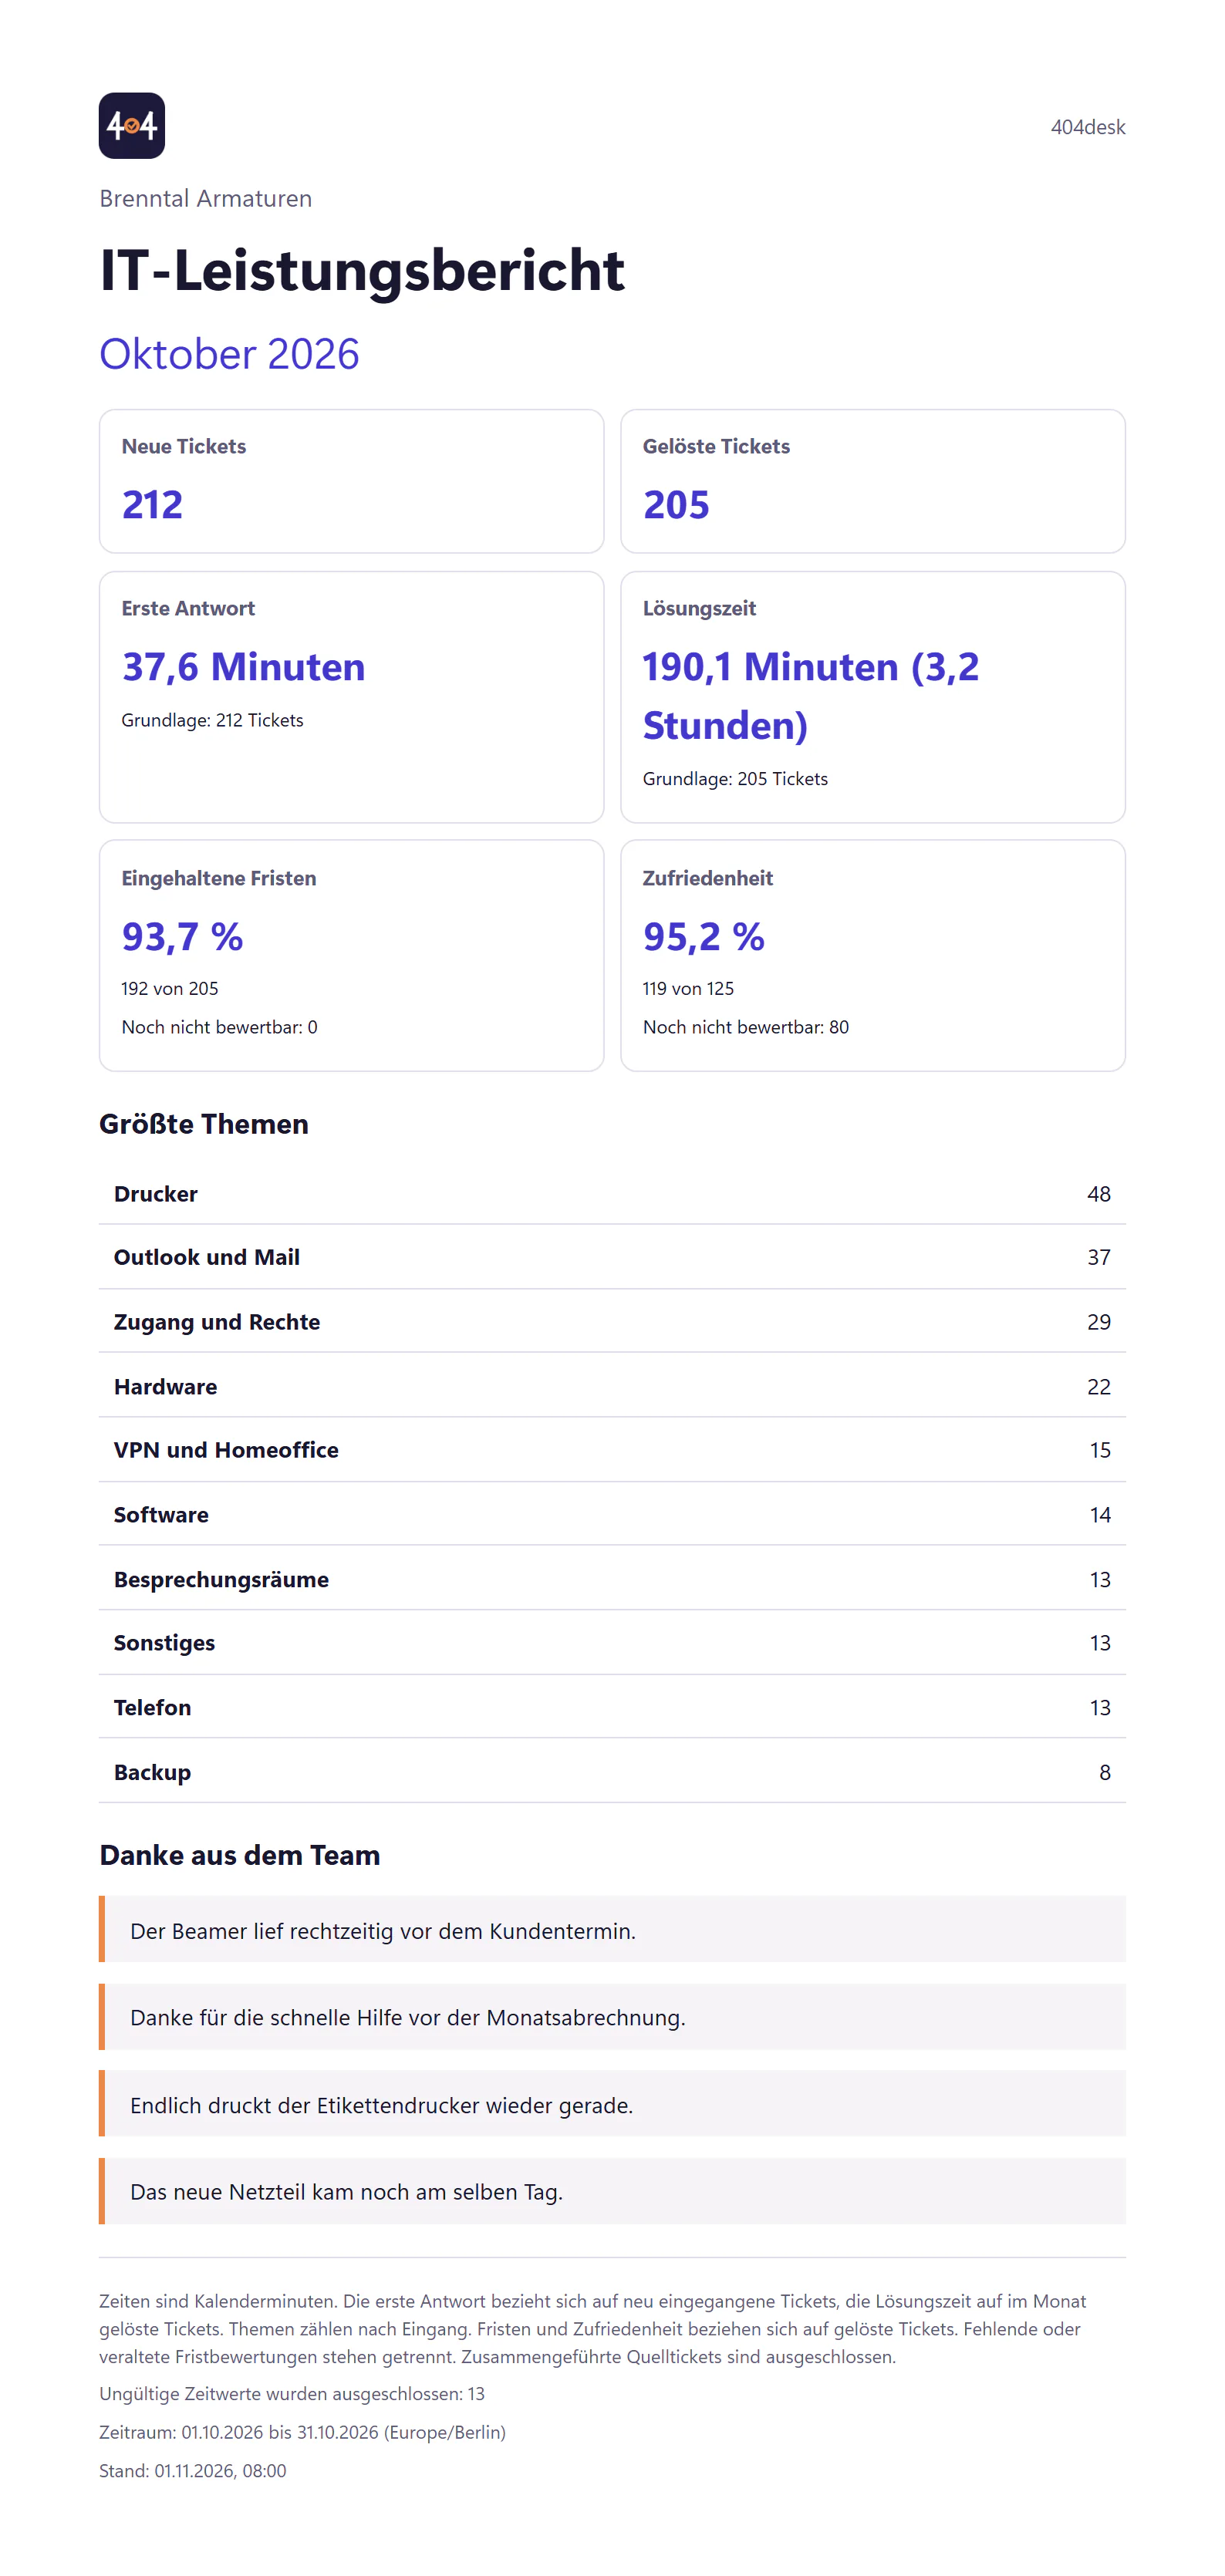
404desk automatically creates an IT service report as a PDF every month. It contains ticket volume, speed, satisfaction, thank-you messages, the leading topics and how many deadlines were met. Management sees at a glance what IT delivers, without you building a presentation at the end of the month.
How the report reaches management
Set it up once
Switch on the monthly delivery and select the recipients. That is all.
Calculate the month
At the end of the month, 404desk works it out from that month’s tickets, deadlines and feedback.
Deliver the PDF
From 08:00 on the first day of the following month, in the report schedule’s timezone, the PDF with your company’s logo is created. Then the email with a personal link to the report goes out.
Discuss the service
Anyone who asks what IT actually does gets figures instead of a feeling.
What is in the report and what is not
New and resolved tickets, first-response and resolution times, satisfaction, approved thank-you messages, leading topics and deadlines met. These are team-level figures that management can read without an explanation.
Individual ticket contents are excluded. Management needs to know how many scanner issues occurred, not which warehouse employee reported one. Thank-you messages appear only after the author has approved them and IT has reviewed them. There is no name line, and the message itself is not edited. Unreviewed messages stay out of the automatic report.
You can also create and download a PDF manually for a completed month. Manually created reports are not emailed automatically.
How management reads the report
The trend matters more than a single month. If ticket volume rises over several months without resolution time getting worse, IT is working more efficiently. If both rise, capacity is missing. A topic that tops the list every month is a candidate for an investment or a guide. The report gives you the figures, and you draw the conclusions together.
Who gets the most out of the report
For IT people whose work only gets noticed when something fails. A quiet month looks from the outside like a month in which IT did nothing. The report then says: 212 tickets, thanked 41 times, 94 of 100 deadlines met.
For management, the report is the basis for budget and staffing. More on this on the page IT ticketing for business leaders.
Questions about the IT service report
Who gets the report?
You choose the recipients from the people in your company workspace, for example management and finance. They receive an email with a personal link to the PDF, valid for seven days.
Do individual admins’ names appear in the report?
No. The report shows the figures for IT as a whole. Thank-you messages appear only if the person has approved them for the report, and without a name line. Whatever someone types into the message themselves stays in. 404desk points this out when they approve it. Before the messages go into the report, IT checks them in a preview and can deselect individual ones.
Can I customise the report?
The structure is fixed. Your company’s logo is on it. You get your own figures through the CSV export in Analytics.
Related features
- AnalyticsThe figures behind the report: ticket volume, first reply, resolution time, SLA performance, backlog, categories, satisfaction and workload. Export metrics as CSV.
- Business leadersUnderstand IT workload, costs and data handling. Monthly service reports, clear pricing and a German DPA to review before the self-service trial.
- Six IT service desk metrics a small team can useMeasure first response, resolution, SLA compliance, backlog age, recurring issues and satisfaction. Practical examples without individual rankings.