

IT help desk reporting: Analytics without a report builder
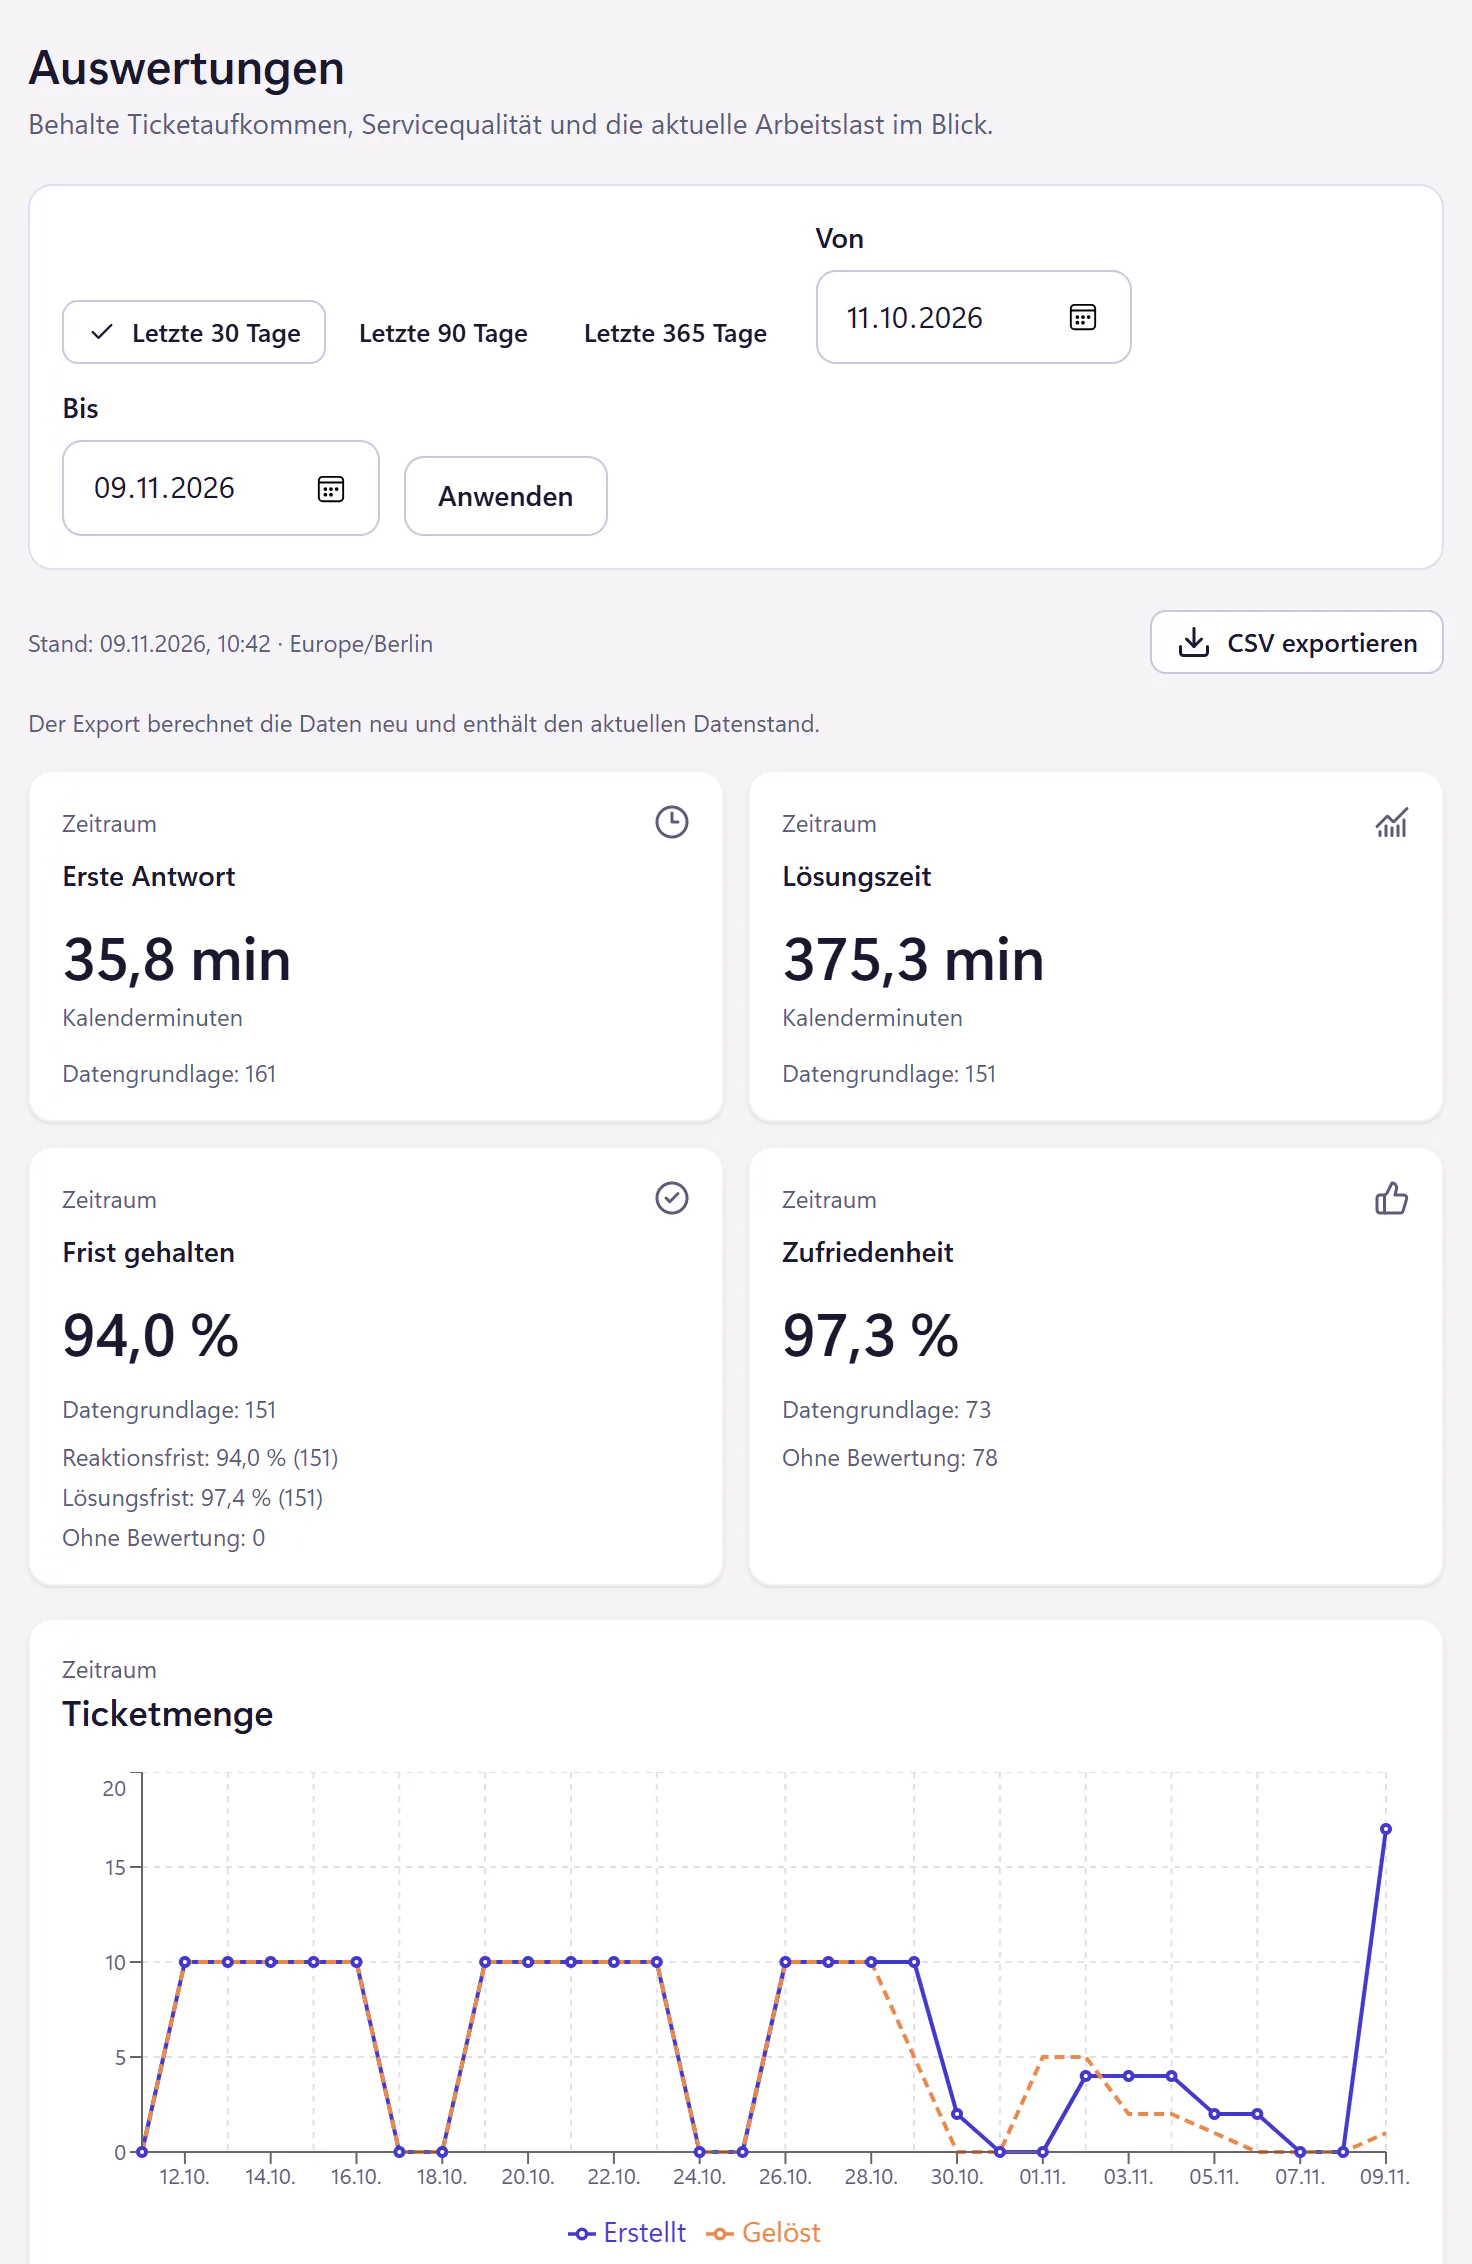
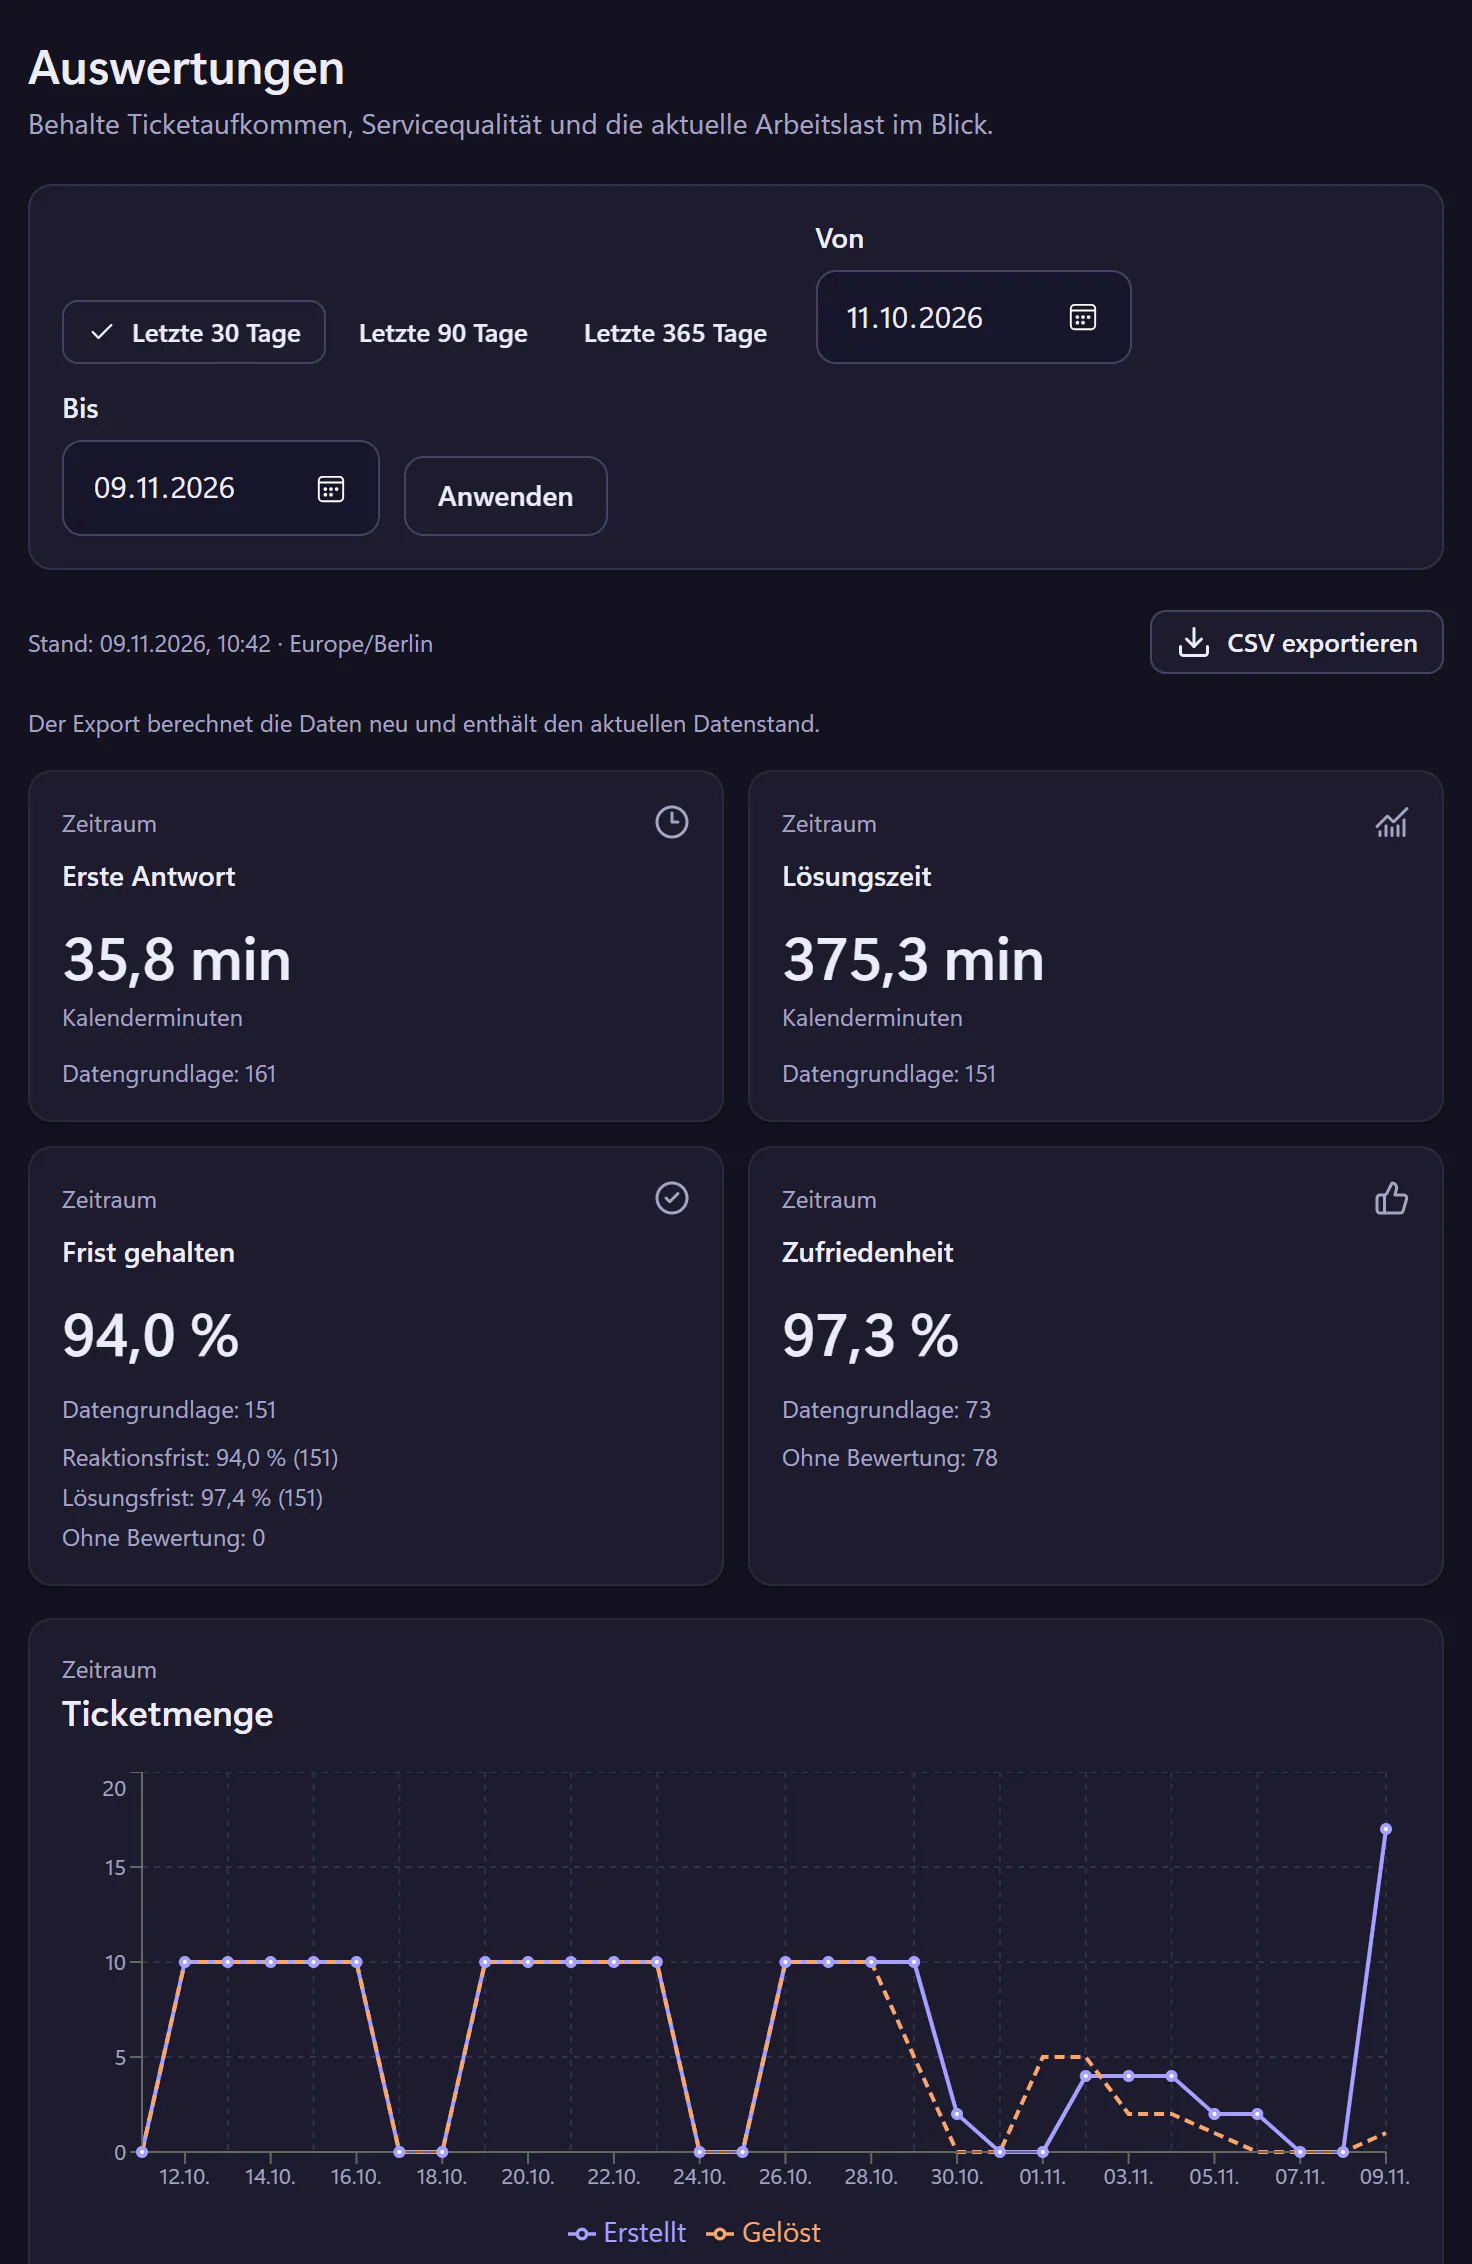
Analytics comes built in, with the figures an internal IT team needs: ticket volume over time, time to first reply, resolution time, deadlines met, age of open tickets, most common categories, satisfaction and workload by admin. You do not have to click a report together. For anything you want to calculate further, export the metrics as CSV.
How to use Analytics
Choose a period
The last 30, 90 or 365 days, or a custom period of up to one year.
Look for patterns
Is a category growing, is one person consistently above the others, are tickets getting older?
Act
A knowledge base article for the most common question, an automation for assignment, a conversation about workload.
Export if needed
The metrics as CSV, for your own spreadsheet or budget planning.
Which Analytics views are built in
- Volume
- Tickets created and resolved over time.
- Speed
- Time to first reply and resolution time, as averages.
- Deadlines
- How many response and resolution targets were met.
- Backlog
- Age of open tickets, in age bands and with the oldest ticket.
- Topics
- Most common categories.
- Satisfaction
- Thumbs up and thumbs down after resolution.
- Workload
- Open tickets per admin.
- Export
- The metrics as CSV.
Reading the numbers correctly
First reply and resolution time are shown as averages in calendar minutes, so nights and weekends count. A single ticket that waits three weeks for a spare part therefore pushes the value up. Look at the age of open tickets as well. Whether a deadline was met, on the other hand, is calculated in business hours, and pauses do not count. And workload by admin shows quantity, not difficulty: whoever takes the hard tickets has fewer. There is more in the guide IT service desk metrics.
Export for your own calculations
The CSV export contains the metrics for the chosen period, each with its unit, data basis and as-of date. You can carry on calculating in Excel or Power BI, without access to the database. Individual tickets are not in the export. Retrieve them when you need them through the REST API.
Who Analytics is for
IT leads who want to talk about staffing, budget and priorities with numbers instead of impressions. A second IT position is easier to justify if ticket volume has been rising for a year and resolution time with it. And if printers cause 48 of 212 tickets, that is an argument for a maintenance contract.
For management, the IT service report summarises the most important figures every month as a PDF.
Frequently asked questions
Can I build my own reports?
No. The Analytics views are fixed. For your own calculations, export the metrics as CSV or retrieve the tickets through the REST API.
Can everyone in IT see the workload by admin?
Yes. Everyone with the IT or admin role can see Analytics. Employees in the portal cannot.
What does the works council have to say?
The "Workload by admin" view shows figures per person. Whether and how your works council needs to be involved is for you to settle internally. The guide on ticketing systems and the works council helps you prepare.
Related features
- IT service reportAn automatic PDF with ticket volume, response and resolution times, satisfaction, employee thanks, leading topics and SLA performance.
- WallboardDisplay open tickets, approaching deadlines and incidents as large numbers. A wallboard link works without sign-in. Includes a JSON endpoint for LED displays.
- Six IT service desk metrics a small team can useMeasure first response, resolution, SLA compliance, backlog age, recurring issues and satisfaction. Practical examples without individual rankings.